Thursday, December 3, 2020

GIS Portfolio


I have nearly finished with all of my coursework for my GIS certificate.  One of the last things I was required to do was to create a portfolio.  We had the option of creating a pdf portfolio or a web portfolio.  I chose to make my portfolio in google docs which is easy to share either online or by printing it out and does not come with some of the issues that can arise when creating a website.  My portfolio includes work that I have done during my time at UWF as well as some of my own independent projects.  My portfolio document can be viewed here.

Alongside the portfolio, we were tasked with recording a short audio interview.  In this interview I go over some common GIS interview questions as well as parts of my web portfolio.  You can listen to my interview here.

Monday, November 30, 2020

GIS day

 This year GIS day was the 18th of November.  Because of the global pandemic, we could not celebrate it in person but the organization I am currently conducting my internship with - the Office of Surface Mining and Reclamation Enforcement - held GIS day online through Microsoft Teams.

For GIS day we had an array of different GIS professionals within the organization give short presentation.  This ranged from coming to terms with a client who wants you to make an ugly map to writing a Python program to interface with ArcGIS Online's API.

My favorite presentation that was given that day was using GIS to help figure out if contaminated water from a mine was seeping out into the stream and hurting a population of endangered crawfish that had an extremely small habitat area. If it was the mine causing this problem, then it would be the Office of Surface Mining and Reclamation Enforcement's fault for not properly enforcing the Surface Mining Control and Reclamation Act (SMCRA) and they would be found liable within the lawsuit.  That area of West Virginia is also where there is a lot of ATV traffic going through the streams.  They wanted to see if they could definitively prove if it was the pollution from the mine water or the ATVs hurting the crawfish population. They did they by placing devices at various points within the stream that would measure things like water turbidity and rainfall.  The more the water was churned up, the more hostile the environment is to the crawfish.  When it rained, there was some turbidity presumably from the mine water.  However, when it wasn't raining there were also turbidity spikes, especially on weekends when people are most likely to be riding ATVs.  The results were mapped so that this information could be presented in court. It was very enjoyable to see how other people used GIS in their jobs in ways that I had never thought of before.

Monday, November 23, 2020

Unsupervised & Supervised Classification

 This week we return to using ERDAS imagine in order to look into different ways of classifying satellite imagery.  The process of classifying imagery is where all the values of a raster image are assigned to a value, such as a land cover or use type.  This can be done by hand (unsupervised) or automatically (supervised) based off of areas of interest (AOI).  Once areas of an image are classified, it is possible to preform calculations such as the amount of area a particular classification takes up.

This depicts how land is used within Germantown, Maryland.  Tracking land use over time is a good way to measure how different areas have urbanized.

Sunday, November 15, 2020

Spatial Enhancement, Multispectral Data, and Band Indices

 This week we returned to ERDAS Imagine to explore the various filters that can be used within the program to manipulate imagery.  It is possible to manipulate spatial data in such a way to enhance it so that certain features become more apparent or more generalized.  Filters use kernels which are a kind of matrix that calculates out the new data for the new image.  The type of calculation used and the size of the kernel determines the look of the final product.

Another thing you can do in ERDAS Imagine is look at the histogram for a piece of imagery.  This histogram shows the frequency of a value.  The more common the value is within a band the more common it is.  It is possible to display the same imagery through a wide mix of the different bands the imagery was collected in so that the desired elements are better highlighted.


This collection of maps shows different elements within the imagery that we were assigned to find via histogram values.  The difference subsections are all shown via a different collection of bands as to highlight the different aspects featured.

Monday, November 9, 2020

ERDAS Imagine

 This week in remote sensing we learned the basics of the ERDAS Imagine software.  ERDAS Imagine is a remote sensing application designed to view raster data and help prepare it to be used in other GIS software.  We explored concepts such as the different types of resolutions for remotely sensed imagery and performing area calculations.

This is a selection of raster imagery that was originally opened using ERDAS Imagine.  It was then exported to ArcGIS Pro to create this layout that depicts the square mileage of the different ground cover types.


Tuesday, November 3, 2020

LULC Classification and Ground Truthing

 Land use/land cover (LULC) classification is the process of looking at an aerial image and assigning a region a value based off of the visible features that indicate what the area is used for.  I utilized the USGS Standard LULC system to determine the level I and the level II classifications.  The higher the level classification the more specific it is.  For example a level I 2 is agricultural land, while the level II classification of the same space could have a code of 21 to denote cropland or pasture.

An important way to follow up on this is to go through the process of ground truthing.  This being an online class, it would not be easy for me to verify these locations in person.  Instead, I used google street view as the next best way to visit these areas.  I was only 66% accurate in my judgement of the area from the aerial photography alone.  The most common land type I would mix up was mistaking commercial for industrial land.  I was very reliable with judging residential land, however.

The land use and land cover map of Pascagoula, Mississippi with ground truthing markers.

Sunday, October 25, 2020

Remote Sensing - Visual Interpretation

This week is the first week of remote sensing which means this is also the week of my last class for the graduate certificate in GIS.  Being the first week, this served as a introduction to different ways we can look at imagery to glean information from it.

For the first part, we went over tone and texture.  Tone is the lightness or darkness of an area which ranges from very light to very dark.  Texture is the coarseness of the of an area which ranges from very fine (like a still pond of water) to very coarse (an irregular forest).  These two elements lay down the building blocks of being able to identify elements of imagery photos.

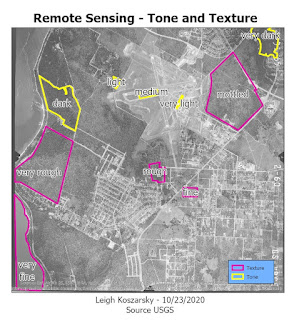
Areas of different tone and texture isolated to show the variance.


In the second part of the lab, we explored other ways identify features.  Shape and size is the most basic of these.  By looking at the shape of something and comparing the size of what is around it you are able to determine what it is.  Pattern is good for noticing things like a parking lot through the paved lines for cars or the rows of crops in the field.  I looked at the shadows of things that were tall and narrow that are difficult to decipher what they are when looking directly above.  This technique is especially useful for things like trees or towers.  Association is where you look at the elements relative to one element to determine what it is.

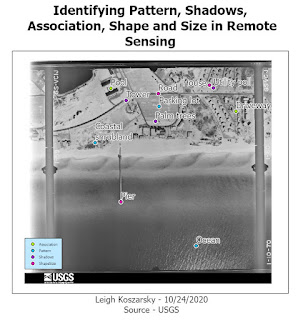
Here I used different aspects such as shape and size, pattern, association and shadows to identify different elements within imagery.

In the last part of the lab we compared true color imagery against false color infrared (IR).  True color imagery is the same as what the human eye would typically see.  False color IR changes the way things are colored in the image.  The most obvious differences are that water becomes very dark and vegetation becomes red.  This false color imagery makes it more obvious to discern what certain elements of an image are.