Friday, July 24, 2020

Crime Analysis

GIS professionals use a variety of hotspot techniques to identify areas that are particularly effected by certain issues.  In this week's lab assignment, the focus was on how hotspot analysis is applied to crime rates and identifying urban areas with the highest incidences of violent crime.

We first looked at instances of burglaries in the DC area.  The first step of using the data was to use a SQL query to parse out particular instances were the offense is coded as a burglary.  The next step was to see how many burglaries were committed within each census tract.  This was done by creating a spatial join between the census tract layer and the burglaries.  The join count field created by this spatial join shows how many burglaries occurred within that census tract.  Some tracts were excluded because of a very low number of households in those areas skewed the results.

A choropleth map of the burglary rate per 1000 homes for each census tract in Washington DC. 
The next map we made used the Kernel density technique to visualize assaults in the DC area.  This method shows clustering but does not provide statistical evidence.  It was important to set the environment to the boundaries of Washington DC before running the tool.  After the tool is run, I changed the classification values to be multiples of the mean value.

A kernel density map showing the assault rate in DC.
The second section of the lab used homicide data from Chicago.  I tested three different methods of creating crime hotspot maps: grid-based thematic, kernel density, and Local Moran's I.

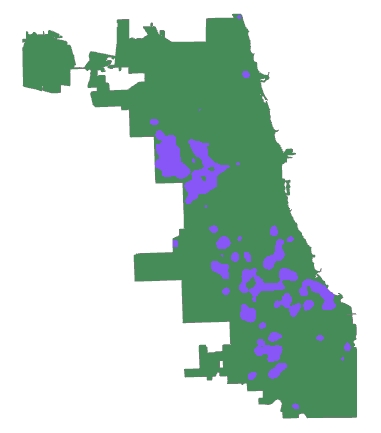
Grid-based mapping used a grid of half mile squares.  After isolating any squares with more than one homicide, I selected the top quintile (20%) to make a layer of the squares with the highest incidence rate of homicides.

Grid squares with the top quntile of homicides in Chicago.

For the kernel density map, I used the kernel density tool on the same set of data as the previous map.  I edited the symbology tool to identify where the homicide rate was triple the mean rate.  I then used the reclassify tool so that the map that displayed the final values showed only the areas with triple the mean rate or higher.

The blue areas show where the homicide rate is triple the mean for Chicago.
Moran's I is another hotspot method.  After calculating the number of homicides per 1000 housing units for each census tract, I used the Cluster and Outlier Analysis (Anselin Local Moran's I) tool.  This creates different spatial clusters, for this map I was interested in "high-high": areas with a hate homicide rate that were also close to other areas with a high homicide rate.  A SQL query was then used to isolate out the high-high values to create the map.

Since Local Moran's I uses the census tracts it looks much more grid like in its results.
Each of these methods produce different results.  It is useful to compare them against each other when determining things like budget and resource allocation.  The grid method identifies the smallest area but has a greater crime density.  The kernel density method is between the other two methods in total area and density, but the amorphous zones may be difficult to easily navigate in reality.  The Local Moran's I map has the highest total area but lowest density.  However since it adheres to the census tracts it is easier to navigate than with kernel density.  When compared applying data from the subsequent year, Local Moran's I also captures the highest percentage of future crimes within the hotspot.

Wednesday, July 15, 2020

Visibility Analysis

This week we used Esri courses to learn about visibility analysis.  Visibility analysis can be used for many things, such as determining sight lines from observer points to target areas or what regions a grouping of security cameras can or cannot see.

This is a linked view of two separate perspectives of the same map.  Moving around one map replicates the same movement in the other so that they match. 

3D is often used for this type of analysis.  It is useful for being able to see multiple viewing angles and understanding the nature of the terrain.  For some maps it makes more sense to use photorealistic imagery and for others it is fine to use more simplistic symbology.  The purpose of the map and the intended viewer influences these decisions.

A scene with 3D buildings and trees.  The goal of this task was to use the global scene feature to explore light and shade at different times of day.
Using GIS to create lines of sight has a wide range of uses.  For example, if a company was looking to build a hotel and wanted to know where to buy land that had the best observation points for well-known landmarks line of sight analysis could be used for determining this.

A demonstration of lines of sight for a parade going through Philadelphia.  This sort of map can be used for knowing where to place security officers so that no section of the parade is in a blind spot.

View shed analysis is another method of using GIS for visibility.  It takes into account what areas are covered by the view shed with regards to things like terrain.  This sort of analysis is commonly used when figuring out where to place security cameras so that all areas of interest are covered.   

This map shows the boundaries of a park and the four lampposts.  The area in white shows where at least two areas of light overlap from two different lampposts.


3D scenes can be exported and shared with others to make projects more easily accessible.

Monday, July 6, 2020

Forestry and LiDAR

This week we learned about the uses and applications of LiDAR in a forestry setting.  LiDAR, short for "light detection and ranging," is used in forestry to get information on the forest canopy and underlying domain which is useful in many aspects of forest management.

The LiDAR data itself and the metadata came from the Virginia LiDAR application.  It then had to be extracted using ESRI's LAS Optimizer.  Importing this into an ArcGIS Pro scene displays the LiDAR data where it can be further manipulated.

From the LiDAR data a DEM was created by first setting the appearance filter to ground and then using the LAS Dataset to Raster tool.  A DSM was created with the same tool but by setting the filter to non-ground points.

To calculate the height of the trees I used the minus tool with the inputs as the DSM and the DEM.  This produced some points that were under zero in height.  This occurred mostly in areas where there were roadways.

To calculate biomass density I used the LAS to MultiPoint tool to generate ground and vegetation layers.  These files are then converted to raster using the Point to Raster tool.  Then I used the Is Null tool to make a binary file where all values that are not null get a value of 1 on both the ground and vegetation layers.  Then, I used the plus tool to combine both of these layers together.  This layer was then converted from integer via the Float tool.  Lastly, the biomass density is generated using the Divide tool.

To supplement the data, I generated a chart from the height layer that was made earlier.  This shows a bar graph of the height of the trees.  I created two maps to display the results from this analysis.
The vegetation density as well as the height with map and chart.

The LiDAR map of the region and the corresponding DEM.