Sunday, October 25, 2020

Remote Sensing - Visual Interpretation

This week is the first week of remote sensing which means this is also the week of my last class for the graduate certificate in GIS.  Being the first week, this served as a introduction to different ways we can look at imagery to glean information from it.

For the first part, we went over tone and texture.  Tone is the lightness or darkness of an area which ranges from very light to very dark.  Texture is the coarseness of the of an area which ranges from very fine (like a still pond of water) to very coarse (an irregular forest).  These two elements lay down the building blocks of being able to identify elements of imagery photos.
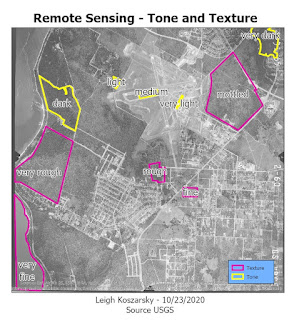
Areas of different tone and texture isolated to show the variance.


In the second part of the lab, we explored other ways identify features.  Shape and size is the most basic of these.  By looking at the shape of something and comparing the size of what is around it you are able to determine what it is.  Pattern is good for noticing things like a parking lot through the paved lines for cars or the rows of crops in the field.  I looked at the shadows of things that were tall and narrow that are difficult to decipher what they are when looking directly above.  This technique is especially useful for things like trees or towers.  Association is where you look at the elements relative to one element to determine what it is.
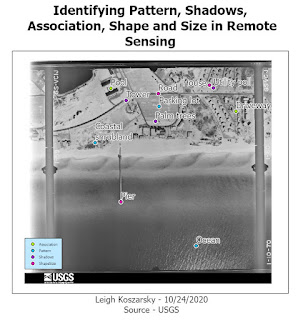
Here I used different aspects such as shape and size, pattern, association and shadows to identify different elements within imagery.

In the last part of the lab we compared true color imagery against false color infrared (IR).  True color imagery is the same as what the human eye would typically see.  False color IR changes the way things are colored in the image.  The most obvious differences are that water becomes very dark and vegetation becomes red.  This false color imagery makes it more obvious to discern what certain elements of an image are.

Monday, October 12, 2020

Scale Effect and Spatial Data Aggregation


This week we investigated how scale has an impact on both raster and vector data.  We also looked at other issues such as the modifiable areal unit problem and how to measure gerrymandering.

To explore the impact on vector data, I compared three sets of data of streams and bodies of water at three different scales.  The larger scale data set had a much greater level of detail showing all the crenelations of each tiny stream, while the smaller scale data set provided a much greater generalization with a lower level of detail.

For the raster data, we were provided with a DEM LiDAR data set.  I then resampled the data at multiple resolutions ranging from 1 meter cells to 90 meter cells.  Then on those resampled layers, I ran the slope tool for each one and looked at the median slope.  The slope value decreases as the resolution becomes lower.  The lower resolution a data set, the less information it captures.

Gerrymandering is the act of drawing a political district to include certain populations and exclude others, in an effort to create a district that is more likely to vote in favor of the party delineating the district's boundaries.  Gerrymandering can be measured using the Polsby-Popper score which is calculated using 4π(Area of the District)/(Perimeter of the District^2).  This measures the level of compactness the district has.  The more compact it is, the closer to 1 the score will be.  Conversely, the closer to zero the score is the worse the boundary is.

The Congressional District 7 of Pennsylvania has a very low Polsby-Popper score of 0.04099574. This district was so blatantly gerrymandered that in 2018 the Supreme Court of Pennsylvania ruled that the boundaries had to be changed.

Sunday, October 4, 2020

Surface Interpolation

 Interpolation is a method for calculating a gradient of change across a surface using point data.  There are multiple different interpolation techniques that can be used to create these surfaces that each have their own pros and cons.  For this particular assignment, we had to use ArcGIS to produce interpolation surfaces using Thiessen polygons, IDW, and two different types of Spline interpolation (Regularized and Tension).

The Thiessen polygons method creates polygons around a single data and applies the value of the point to the polygon.  The IDW, or inverse distance weighted method, determines values by taking into account how close points are.  The further away a point is, the less this method takes into account its value when determining the value of a particular cell.  The spline method works likes a pliable sheet that bends itself through each one of the provided data points.  A regularized spline creates a smoother surface than a tension spline, as a tension spline is more constricted by the values provided by the data points.

The IDW method demonstrating the varying surface water quality within Tampa Bay.