Thursday, December 3, 2020

GIS Portfolio


I have nearly finished with all of my coursework for my GIS certificate.  One of the last things I was required to do was to create a portfolio.  We had the option of creating a pdf portfolio or a web portfolio.  I chose to make my portfolio in google docs which is easy to share either online or by printing it out and does not come with some of the issues that can arise when creating a website.  My portfolio includes work that I have done during my time at UWF as well as some of my own independent projects.  My portfolio document can be viewed here.

Alongside the portfolio, we were tasked with recording a short audio interview.  In this interview I go over some common GIS interview questions as well as parts of my web portfolio.  You can listen to my interview here.

Monday, November 30, 2020

GIS day

 This year GIS day was the 18th of November.  Because of the global pandemic, we could not celebrate it in person but the organization I am currently conducting my internship with - the Office of Surface Mining and Reclamation Enforcement - held GIS day online through Microsoft Teams.

For GIS day we had an array of different GIS professionals within the organization give short presentation.  This ranged from coming to terms with a client who wants you to make an ugly map to writing a Python program to interface with ArcGIS Online's API.

My favorite presentation that was given that day was using GIS to help figure out if contaminated water from a mine was seeping out into the stream and hurting a population of endangered crawfish that had an extremely small habitat area. If it was the mine causing this problem, then it would be the Office of Surface Mining and Reclamation Enforcement's fault for not properly enforcing the Surface Mining Control and Reclamation Act (SMCRA) and they would be found liable within the lawsuit.  That area of West Virginia is also where there is a lot of ATV traffic going through the streams.  They wanted to see if they could definitively prove if it was the pollution from the mine water or the ATVs hurting the crawfish population. They did they by placing devices at various points within the stream that would measure things like water turbidity and rainfall.  The more the water was churned up, the more hostile the environment is to the crawfish.  When it rained, there was some turbidity presumably from the mine water.  However, when it wasn't raining there were also turbidity spikes, especially on weekends when people are most likely to be riding ATVs.  The results were mapped so that this information could be presented in court. It was very enjoyable to see how other people used GIS in their jobs in ways that I had never thought of before.

Monday, November 23, 2020

Unsupervised & Supervised Classification

 This week we return to using ERDAS imagine in order to look into different ways of classifying satellite imagery.  The process of classifying imagery is where all the values of a raster image are assigned to a value, such as a land cover or use type.  This can be done by hand (unsupervised) or automatically (supervised) based off of areas of interest (AOI).  Once areas of an image are classified, it is possible to preform calculations such as the amount of area a particular classification takes up.

This depicts how land is used within Germantown, Maryland.  Tracking land use over time is a good way to measure how different areas have urbanized.

Sunday, November 15, 2020

Spatial Enhancement, Multispectral Data, and Band Indices

 This week we returned to ERDAS Imagine to explore the various filters that can be used within the program to manipulate imagery.  It is possible to manipulate spatial data in such a way to enhance it so that certain features become more apparent or more generalized.  Filters use kernels which are a kind of matrix that calculates out the new data for the new image.  The type of calculation used and the size of the kernel determines the look of the final product.

Another thing you can do in ERDAS Imagine is look at the histogram for a piece of imagery.  This histogram shows the frequency of a value.  The more common the value is within a band the more common it is.  It is possible to display the same imagery through a wide mix of the different bands the imagery was collected in so that the desired elements are better highlighted.


This collection of maps shows different elements within the imagery that we were assigned to find via histogram values.  The difference subsections are all shown via a different collection of bands as to highlight the different aspects featured.

Monday, November 9, 2020

ERDAS Imagine

 This week in remote sensing we learned the basics of the ERDAS Imagine software.  ERDAS Imagine is a remote sensing application designed to view raster data and help prepare it to be used in other GIS software.  We explored concepts such as the different types of resolutions for remotely sensed imagery and performing area calculations.

This is a selection of raster imagery that was originally opened using ERDAS Imagine.  It was then exported to ArcGIS Pro to create this layout that depicts the square mileage of the different ground cover types.


Tuesday, November 3, 2020

LULC Classification and Ground Truthing

 Land use/land cover (LULC) classification is the process of looking at an aerial image and assigning a region a value based off of the visible features that indicate what the area is used for.  I utilized the USGS Standard LULC system to determine the level I and the level II classifications.  The higher the level classification the more specific it is.  For example a level I 2 is agricultural land, while the level II classification of the same space could have a code of 21 to denote cropland or pasture.

An important way to follow up on this is to go through the process of ground truthing.  This being an online class, it would not be easy for me to verify these locations in person.  Instead, I used google street view as the next best way to visit these areas.  I was only 66% accurate in my judgement of the area from the aerial photography alone.  The most common land type I would mix up was mistaking commercial for industrial land.  I was very reliable with judging residential land, however.

The land use and land cover map of Pascagoula, Mississippi with ground truthing markers.

Sunday, October 25, 2020

Remote Sensing - Visual Interpretation

This week is the first week of remote sensing which means this is also the week of my last class for the graduate certificate in GIS.  Being the first week, this served as a introduction to different ways we can look at imagery to glean information from it.

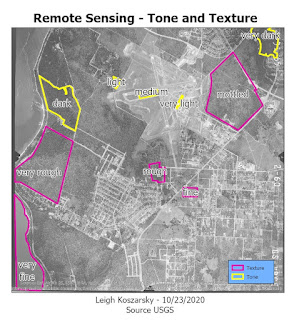
For the first part, we went over tone and texture.  Tone is the lightness or darkness of an area which ranges from very light to very dark.  Texture is the coarseness of the of an area which ranges from very fine (like a still pond of water) to very coarse (an irregular forest).  These two elements lay down the building blocks of being able to identify elements of imagery photos.

Areas of different tone and texture isolated to show the variance.


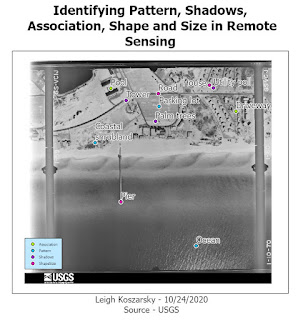
In the second part of the lab, we explored other ways identify features.  Shape and size is the most basic of these.  By looking at the shape of something and comparing the size of what is around it you are able to determine what it is.  Pattern is good for noticing things like a parking lot through the paved lines for cars or the rows of crops in the field.  I looked at the shadows of things that were tall and narrow that are difficult to decipher what they are when looking directly above.  This technique is especially useful for things like trees or towers.  Association is where you look at the elements relative to one element to determine what it is.

Here I used different aspects such as shape and size, pattern, association and shadows to identify different elements within imagery.

In the last part of the lab we compared true color imagery against false color infrared (IR).  True color imagery is the same as what the human eye would typically see.  False color IR changes the way things are colored in the image.  The most obvious differences are that water becomes very dark and vegetation becomes red.  This false color imagery makes it more obvious to discern what certain elements of an image are.

Monday, October 12, 2020

Scale Effect and Spatial Data Aggregation


This week we investigated how scale has an impact on both raster and vector data.  We also looked at other issues such as the modifiable areal unit problem and how to measure gerrymandering.

To explore the impact on vector data, I compared three sets of data of streams and bodies of water at three different scales.  The larger scale data set had a much greater level of detail showing all the crenelations of each tiny stream, while the smaller scale data set provided a much greater generalization with a lower level of detail.

For the raster data, we were provided with a DEM LiDAR data set.  I then resampled the data at multiple resolutions ranging from 1 meter cells to 90 meter cells.  Then on those resampled layers, I ran the slope tool for each one and looked at the median slope.  The slope value decreases as the resolution becomes lower.  The lower resolution a data set, the less information it captures.

Gerrymandering is the act of drawing a political district to include certain populations and exclude others, in an effort to create a district that is more likely to vote in favor of the party delineating the district's boundaries.  Gerrymandering can be measured using the Polsby-Popper score which is calculated using 4Ï€(Area of the District)/(Perimeter of the District^2).  This measures the level of compactness the district has.  The more compact it is, the closer to 1 the score will be.  Conversely, the closer to zero the score is the worse the boundary is.

The Congressional District 7 of Pennsylvania has a very low Polsby-Popper score of 0.04099574. This district was so blatantly gerrymandered that in 2018 the Supreme Court of Pennsylvania ruled that the boundaries had to be changed.

Sunday, October 4, 2020

Surface Interpolation

 Interpolation is a method for calculating a gradient of change across a surface using point data.  There are multiple different interpolation techniques that can be used to create these surfaces that each have their own pros and cons.  For this particular assignment, we had to use ArcGIS to produce interpolation surfaces using Thiessen polygons, IDW, and two different types of Spline interpolation (Regularized and Tension).

The Thiessen polygons method creates polygons around a single data and applies the value of the point to the polygon.  The IDW, or inverse distance weighted method, determines values by taking into account how close points are.  The further away a point is, the less this method takes into account its value when determining the value of a particular cell.  The spline method works likes a pliable sheet that bends itself through each one of the provided data points.  A regularized spline creates a smoother surface than a tension spline, as a tension spline is more constricted by the values provided by the data points.

The IDW method demonstrating the varying surface water quality within Tampa Bay.

Sunday, September 20, 2020

Surfaces - TINs and DEMs


This week the focus was on using and understanding DEMs and TINs.  DEMs are digital elevation models, and TINs are triangular irregular networks.  Both are remotely sensed imagery that are used to convey the three-dimensional surface of the Earth.  This can be used for a wide variety of applications that require knowledge of what the terrain looks like.

DEMs and TINs are similar in many ways but there are differences between the two (Bolstad 2016, 68).  The most obvious difference is that is a DEM is a raster and a TIN is a vector.  The other major difference is that a TIN is able to convey elevation, slope, and aspect simultaneously while a DEM must be geoprocessed into three different layers to show each one of those elements.


TINs can be symbolized to emphasized different characteristics such as slope.  It is also possible to apply an outline to the edge of each triangle, so that when you are looking to click on a particular triangle to find its information it is easier to identify a single one.  Contour lines may also be applied so that differences in elevation are easier to discern.

Bolstad, P. (2016). GIS Fundamentals: A First Text on Geographic Information Systems (5th ed). Eider Press.

Sunday, September 13, 2020

Data Quality Assessment


The goal of this week's lab was to determine the completeness of two separate road networks for Jackson County, OR.  One of the networks was the TIGER file which is created by the US Census Bureau, and the other was created by the county's GIS team.  The methodology for determining completeness was based off of the method used by Haklay (2010) where the study area was broken into grid squares of equal area and the total length in difference between the two networks was compared.  The network with longer road distance in each particular grid square was considered to be more complete.  This was mapped by using the percent difference which was calculated by (total length of Jackson County-created network - total length of TIGER network)/(total length of Jackson County-created network) * 100.

When looking at the county as a whole, the TIGER network is more complete as it has a little more than 500 km of road than the network made by the Jackson county team.  However, as shown in the map below, this does not mean that the TIGER network is more complete in all areas.  The Jackson County team network was more complete for 45.27% of the grid squares, and the TIGER network more complete for 54.73% of the grid squares.

A comparison of completeness between the two road networks.  The pink areas are where the TIGER network is more complete, and the green squares are where the Jackson County-created network is more complete.

Haklay, M. (2010). How Good is Volunteered Geographical Information? A Comparative Study of OpenStreetMap and Ordnance Survey Datasets. Environment and Planning B: Planning and Design, 37, 682-703. doi:10.1068/b35097

Saturday, September 5, 2020

Data Quality

Continuing with the same focus of last week on positional accuracy, we compared two different road networks of the city of Albuquerque for positional accuracy.  The first network tested was made by the city of Albuquerque itself and the second was made by StreetMapUSA.  As to be expected, the network produced by the city of Albuquerque was considerably more accurate of the two since they have a much greater vested interest in having an accurate map of their own city (e.g. for properly dispatching ambulances for 911 calls).

To compare the accuracy of a network map you need to have a reference map to work from.  For the independent reference points we used the orthographic satellite photos to find intersections that exist on both map networks.

The next step of the positional accuracy process is to set the points.  Each point for both networks and the ortho photos has to be for the same intersection.  It is also important to get an even spread of points across the study area.  For best accuracy, greater than 20% of the points should be present in each quadrant and the points should be spaced out from one another.  At least 20 test points are required for reliable results.

After picking the points and then exporting them to an Excel spreadsheet, I took that raw data to process the accuracy assessment.  For each point on the network, the difference in the latitude and longitude is found.  Then, that difference is squared.  And the squared difference of both latitude and longitude are added together.  The sum of the squared differences is calculated, and then the average of that sum is also calculated.  Finding the square root of the average of the sum of the difference in latitude and longitude squared gives the RSME.  Multiplying the RSME by a provided value (in this case, the National Standard for Spatial Data Accuracy statistic determines that to be 1.7308 for horizontal accuracy) gives the final NSSDA value.  The lower the value the better the positional accuracy.


A road network map with the associated points for the intersections.  Both of the network layers and the reference points (from the ortho imagery) each had their own set of 20 points that all corresponded to like intersections.

The final results on accuracy are as follows:

Streetmap:
Tested 478.683 feet horizontal accuracy at 95% confidence level

Vertical positional accuracy: not applicable 

ABQ:

Tested 21.669 feet horizontal accuracy at 95% confidence level Vertical positional accuracy: not applicable


Thursday, August 27, 2020

Calculating Spatial Data Quality

This fall I begin Special Topics in GIS as I enter the last semester for my graduate certificate in GIS.  This week's focus was on methods of calculating spatial data quality.

The first task was to calculate the horizontal and vertical data accuracy and precision based off of data acquired from a handheld GPS device.  Accuracy is how close values are to an accepted reference value.  While precision is how close values are to one another (for example, a cluster of GPS points from the same device measuring the same spot would all be precise).

We started with a collection of GPS points that were all recording the same location.  Then, to find the average of the points I found the mean latitude and longitude values of all the collected GPS points and created a new average point of all of them in its own feature class.

Next, I made a multi-ring buffer around this average point.  I calculated the distances for each buffer by finding what the values would be for where 50%, 68%, or 95% of the points are within the buffer.  I found the index for each particular percentile by taking the waypoints feature class that was spatially joined with the average point to create a new distance field and then multiple the total number of waypoints by the desired percentile to find the corresponding index value.  This index value is the distance at which that percentile of points would be inside of the buffer.  This method of creating a multi-ring buffer is to show how precise the data collection process was.


68% of the points in this data collection fell within 4.4 meters of the location of the averaged waypoint.

Another important feature of data quality is to measure the accuracy of the data.  We did this using data from an absolute reference point that was established outside of the data collection process.  The majority of this work was done in Microsoft Excel using .dbf files.  I used waypoint data and compared it against benchmark data to calculate the values that were used in the cumulative distribution function graph. 

Consulting this graph shows the likelihood that a given value will be within that distance from the reference point.  This particular GPS device only has about a 10% chance of being within a meter of the reference point for any particular reading.


The CDF shows how likely it is for a point measured using the GPS to be a certain distance from a reference point.  Knowing the accuracy of a GPS device is important since some project may suffer from poor data accuracy.


Wednesday, August 5, 2020

Damage Assement

A substantial part of work that GIS professionals do at organizations like FEMA is assessing how areas where damage after a natural disaster.  Damage assessment is useful for evaluating the hardest hit areas and the extent of reconstruction necessary.  This week's lab involved assessing the damage caused by Hurricane Sandy after it made landfall new Atlantic City, New Jersey.  Even though it only struck the area as a category 1 hurricane, not only was the area not accustomed to hurricanes, but the hurricane was also the largest ever recorded.

To assess damage, the first step was to import both pre-storm and post-storm imagery of the area.  I also added in a parcel layer to make it cleared exactly what the boundaries would be for each damage assessment.  Before I could assess the damage, I had to create attribute domains to constrain the data input values so that they could only be from a select set of options and less subject to input error.  The domain particularly useful for this assignment was a structure damage domain set to coded values from zero to four - with zero being no damage and four being completely destroyed.  Following that, I created a new feature class that I set to use the domains that I had just created.

Then came the part where I actually determined the damage.  I found it easiest to first create a point for each of the parcels and then to go through each one and set the level of damage.  I think for someone who did this work regularly it would be useful to have two high resolution monitors so they could see as much of the imagery as they could as well as the tables at the same time.  Judging how much damage there was from only satellite imagery was difficult.  It was easy to see when a building was completely destroyed, but harder to discern between "affected" and "minor damage" in a real world situation it would be ideal to have someone on the ground assess each parcels from up close.

Each of the parcels in the study area were assigned a structure damage value based off of the discernible damage that could be seen from the satellite imagery.
 
The next step was to determine how distance from the coast impacted the extent of the damage.  I created a new feature class for the coast and drew it in as a line.  I then used the multi-ring buffer tool to establish three different ranges of distance.  Next, I used the clip tool to clip out only the parcels in the selected study area.  Then I used spatial join on the clipped parcels with the structure damage data so that the parcels have the structure damage value.  Once again I used the spatial join tool on the layer created in the previous step with the multi-ring buffer.  This gives each parcel in the study area a damage value and a distance value.  Lastly, I got all the numbers by using the select by attribute tool to get all of the counts (ex query: “WHERE distance is equal to 300 AND structure damage is equal to 2”).

The results of the damage assessment for each of the buffer zones.

As is to be expected, areas closer to the coast were generally hit harder by the storm.  This is a fairly small sample size and I would resist the temptation to extrapolate the same data throughout the entire area.  However, this process could be repeated throughout other sections and the results could be used to help form a more complete picture.


Saturday, August 1, 2020

Coastal Flooding

The primary focus of the lab was using LiDAR or USGS DEM data to predict areas that would be impacted by an incoming storm surge. This week's lab was a bit more of a challenge for me than I typically experience.  I had some troubles getting the tools to run properly, or they had extremely long run times.  Ultimately, I did produce the final products though.

Our first task was to use LiDAR data from before Hurricane Sandy hit and after.  This comparison shows where the buildings were destroyed or where debris piled up based off of the change in height between the two layers.  You can do additional analysis by data in current data with the existing buildings to see where structures have been rebuilt or replaced.

The height changes that can be seen with LiDAR shows that worst of the destruction was right along the coast.

For the second map we had to create we used data for Collier County in Florida.  We compared the USGS DEM to the LiDAR DEM and then saw which buildings would be impacted by a one meter high storm surge.  The LiDAR data is considered to be more accurate based off of the high accuracy of LiDAR itself.  When the two are compared against one another it is even more obvious that it is very challenging to accurately predict exactly where a storm will hit the hardest.
The USGS DEM differs somewhat from the LiDAR layer.  There are even more factors than a storm surge area alone can completely account for.

Friday, July 24, 2020

Crime Analysis

GIS professionals use a variety of hotspot techniques to identify areas that are particularly effected by certain issues.  In this week's lab assignment, the focus was on how hotspot analysis is applied to crime rates and identifying urban areas with the highest incidences of violent crime.

We first looked at instances of burglaries in the DC area.  The first step of using the data was to use a SQL query to parse out particular instances were the offense is coded as a burglary.  The next step was to see how many burglaries were committed within each census tract.  This was done by creating a spatial join between the census tract layer and the burglaries.  The join count field created by this spatial join shows how many burglaries occurred within that census tract.  Some tracts were excluded because of a very low number of households in those areas skewed the results.

A choropleth map of the burglary rate per 1000 homes for each census tract in Washington DC. 
The next map we made used the Kernel density technique to visualize assaults in the DC area.  This method shows clustering but does not provide statistical evidence.  It was important to set the environment to the boundaries of Washington DC before running the tool.  After the tool is run, I changed the classification values to be multiples of the mean value.

A kernel density map showing the assault rate in DC.
The second section of the lab used homicide data from Chicago.  I tested three different methods of creating crime hotspot maps: grid-based thematic, kernel density, and Local Moran's I.

Grid-based mapping used a grid of half mile squares.  After isolating any squares with more than one homicide, I selected the top quintile (20%) to make a layer of the squares with the highest incidence rate of homicides.

Grid squares with the top quntile of homicides in Chicago.

For the kernel density map, I used the kernel density tool on the same set of data as the previous map.  I edited the symbology tool to identify where the homicide rate was triple the mean rate.  I then used the reclassify tool so that the map that displayed the final values showed only the areas with triple the mean rate or higher.

The blue areas show where the homicide rate is triple the mean for Chicago.
Moran's I is another hotspot method.  After calculating the number of homicides per 1000 housing units for each census tract, I used the Cluster and Outlier Analysis (Anselin Local Moran's I) tool.  This creates different spatial clusters, for this map I was interested in "high-high": areas with a hate homicide rate that were also close to other areas with a high homicide rate.  A SQL query was then used to isolate out the high-high values to create the map.

Since Local Moran's I uses the census tracts it looks much more grid like in its results.
Each of these methods produce different results.  It is useful to compare them against each other when determining things like budget and resource allocation.  The grid method identifies the smallest area but has a greater crime density.  The kernel density method is between the other two methods in total area and density, but the amorphous zones may be difficult to easily navigate in reality.  The Local Moran's I map has the highest total area but lowest density.  However since it adheres to the census tracts it is easier to navigate than with kernel density.  When compared applying data from the subsequent year, Local Moran's I also captures the highest percentage of future crimes within the hotspot.

Wednesday, July 15, 2020

Visibility Analysis

This week we used Esri courses to learn about visibility analysis.  Visibility analysis can be used for many things, such as determining sight lines from observer points to target areas or what regions a grouping of security cameras can or cannot see.

This is a linked view of two separate perspectives of the same map.  Moving around one map replicates the same movement in the other so that they match. 

3D is often used for this type of analysis.  It is useful for being able to see multiple viewing angles and understanding the nature of the terrain.  For some maps it makes more sense to use photorealistic imagery and for others it is fine to use more simplistic symbology.  The purpose of the map and the intended viewer influences these decisions.

A scene with 3D buildings and trees.  The goal of this task was to use the global scene feature to explore light and shade at different times of day.
Using GIS to create lines of sight has a wide range of uses.  For example, if a company was looking to build a hotel and wanted to know where to buy land that had the best observation points for well-known landmarks line of sight analysis could be used for determining this.

A demonstration of lines of sight for a parade going through Philadelphia.  This sort of map can be used for knowing where to place security officers so that no section of the parade is in a blind spot.

View shed analysis is another method of using GIS for visibility.  It takes into account what areas are covered by the view shed with regards to things like terrain.  This sort of analysis is commonly used when figuring out where to place security cameras so that all areas of interest are covered.   

This map shows the boundaries of a park and the four lampposts.  The area in white shows where at least two areas of light overlap from two different lampposts.


3D scenes can be exported and shared with others to make projects more easily accessible.

Monday, July 6, 2020

Forestry and LiDAR

This week we learned about the uses and applications of LiDAR in a forestry setting.  LiDAR, short for "light detection and ranging," is used in forestry to get information on the forest canopy and underlying domain which is useful in many aspects of forest management.

The LiDAR data itself and the metadata came from the Virginia LiDAR application.  It then had to be extracted using ESRI's LAS Optimizer.  Importing this into an ArcGIS Pro scene displays the LiDAR data where it can be further manipulated.

From the LiDAR data a DEM was created by first setting the appearance filter to ground and then using the LAS Dataset to Raster tool.  A DSM was created with the same tool but by setting the filter to non-ground points.

To calculate the height of the trees I used the minus tool with the inputs as the DSM and the DEM.  This produced some points that were under zero in height.  This occurred mostly in areas where there were roadways.

To calculate biomass density I used the LAS to MultiPoint tool to generate ground and vegetation layers.  These files are then converted to raster using the Point to Raster tool.  Then I used the Is Null tool to make a binary file where all values that are not null get a value of 1 on both the ground and vegetation layers.  Then, I used the plus tool to combine both of these layers together.  This layer was then converted from integer via the Float tool.  Lastly, the biomass density is generated using the Divide tool.

To supplement the data, I generated a chart from the height layer that was made earlier.  This shows a bar graph of the height of the trees.  I created two maps to display the results from this analysis.
The vegetation density as well as the height with map and chart.

The LiDAR map of the region and the corresponding DEM.


Tuesday, June 30, 2020

Corridor Analysis and Least Cost Path

The second map I've produced for Application in GIS is a corridor analysis of potential black bear movement between two protected areas of Coronado National Forest.  This sort of analysis is useful for conservation efforts so environmentalists and park rangers can have some idea where black bears are most likely to be encountered.

For the creation of this corridor I took into account three factors: distance from roads (bears prefer to be farther away), elevation (bears have a preference for elevations 1,200 to 2,000 meters), and land cover (certain types of land are more suitable to black bears).  For the road distance, I took the roads shapefile and used the euclidean distance tool.  From there I reclassed the distances appropriately to create a new raster.  I also used the reclassify tool on the elevation and land cover raster to take into account suitability.

Then, I combined these rasters using the weighted overlay tool.  I gave a weight of 60% to land cover and 20% to the two remaining rasters.  This creates a raster that shows the general suitability of an area for a black bear.

For the creation of a least cost raster, I used the reclassify tool to invert the values.  The new values, or the cost surface, where calculated by 10 minus the suitability score.  After that it was necessary to create two cost distance rasters.  The least cost surface raster was combined two separate times.  Finally, these two cost distance rasters are combined using the corridor tool to create the desired corridor output.

The darker the red the more likely a black bear is to travel within that area when going between the two protected forested zones.
The next step in getting the map ready for production is to determined the desired extent of the corridor.  I did this by finding the lowest overall value in the corridor and multiplying that by 1.1, 1.2, and 1.3 for each of the red bands where the bears are the most likely to travel.

With this map it is much easier for the park rangers to know where the bears are likely to travel, especially in areas near to roads.  They can put up signage or other warnings to alert travels that they are more likely to see a bear there.  Or they could try to petition for changes such as a wildlife bridge which serves to keep both people and animals safer.

Friday, June 26, 2020

Suitability Analysis

This is the first week of Applications in GIS.  For just starting out we have a pretty rigorous initial project - land suitability analysis.  Land suitability analysis is where certain factors are taken into account, such as slope or land cover type, and assigned values corresponding to their qualities and the desired usage of the land.  These different attributes are combined with the weighted overlay tool to find the areas that most fit the desired properties.

This particular map was designed with land development in mind.  If a developer wanted to buy up empty lots in an undeveloped area there are several things they would want to take into account before making their purchase.  This spatial analysis takes into account slope (lower the better), land cover (which ones are easier to develop), soil type (certain types are more conducive to easy construction), distance from rivers (don't want to be on top of a stream in case it floods), and distance from roads (closer is better).  Using spatial analysis it is possible to assign all these traits certain values and combine them together to identify the best regions.

The map on the left treats all the properties with equal weight while the map of the right puts greater emphasis on slope and less on distance from rivers and roads.  Using alternative weights can be useful as building on a steep slope could be much costlier and more undesirable to live on than living further away from a road. The resulting areas are slightly different, especially for the equal weight areas by the river which are mostly excluded from the prime valuation.  Comparing different methods is useful in judging what decision is best for the project.
This map shows how weighting all the different traits equally versus giving them different weights produces a different final result.
This first assignment really feels like we are starting to get to the core of GIS.  There is a lot less step-by-step guidance in the homework at this point.  I am starting to feel more confident in my skills as time goes on.

Thursday, June 25, 2020

About Me

Hello!

My name is Leigh Koszarsky.  I received my undergraduate degree from University of Rochester in history and anthropology.  My Master's degree is from UMass Boston in Historical archaeology.  My goal with learning GIS is to eventually be able to apply it back to my work in archaeology.

I enjoy illustration, reading, and playing Pokemon Go.

I also made a story map here.


Saturday, June 20, 2020

Other Python Applications

This blog is typically dedicated to my GIS work, but since I've had lots of time during COVID-19 quarantine to work on other things I thought I'd use this space to show off something else I've made in python.  I made a twitter bot that generates characters for the popular table top game Dungeons and Dragons.  This bot comes up with a name, personality trait, fantasy race, and occupation for the character.  It also generates a short bio and gives them a list of stats.

It started out as a very simple few lines of code to see if I could recreate rolling a six sided die:
A d6 is just a normal 6-sided die like you would use in a normal board game.  The "quant" parameter asks for how many dice you want to roll.  By default it is set to just one.
Well that was easy enough.  What can I do with this function?

A Dungeon and Dragon's character has six different stats: strength, dexterity, constitution, intelligence, wisdom, and charisma.  Typically these stats range from 0 (very poor) to 20 (excellent).  These stats determine how likely a character is to succeed or fail at a certain task.  Throwing a javelin requires strength, while picking a lock involves dexterity.  The next logical step with this program is to use dice rolling to assign numbers to these stats.  The most straight forward way to roll for stats is simply rolling three six-sided die for each stat.  In python this looks as follows:

This calls the d6 function six times and appends the value generated with three virtual dice to a list.
Great!  But what if you wanted a more complicated method of rolling?  Some methods are designed to generate more powerful or more balanced characters.  I ended up developing eleven different roll methods in all (some coming from this source and others of my own creation).

Here's one of the more complicated ones.  This one rolls four six-sided dice for each stat and drops the lowest of the for dice in the set.  The tricky part comes in where the roll method dictates that at least one of the stats must be above 15.  I achieve this with if any(num > 15 for num in rollstats).
If any value in the list is above 15 the code will continue and return the list.  If not the function becomes recursive and runs itself again until it meets the desired criteria.
This method continues recursively until it returns a list where at least one value is above 15.
Now that I have different ways of assigning stats to a character the next step is to give them a name and some basic attributes.  I accomplish this by making a different lists - firstname, lastname, trait, fantasyrace, and occupation.  I fill these up with as many different values that I can think of and then use random.choice on each list to pick out a value for each one.

I added an extra level of depth here by making each fantasy race a tuple instead of just a simple string value.  Why a tuple?  Because each species has slightly different stat modifiers.  Orcs are strong and dwarves are tough so that extra boosts should be reflected in their stats on top of those they roll for.  Calling on a certain point in each tuple to add these values is much faster and easier than writing a complicated if/else statement that achieves the same thing.

There are a lot of different species available to play as in the game each with their own unique traits.
After this to add a bit of flavor to the characters I gave them a short bio.  This picks one of over forty sentences to call upon and pick different nouns from a variety of lists.  This adds variety to the characters and gives the game master a little bit more to work with in terms of providing the character with a backstory or set of motivations.

Once all the individual pieces are created they are assigned to a single variable that makes up the whole character.  With a little bit of work in git, heroku, and getting a twitter developer account approved the script was ready!  In heroku the script is programmed to tweet out a new character four times a day.  The code itself can be viewed here on Github.
This guy is pretty strong as long as no one puts cream in his coffee.


Friday, June 19, 2020

Working with Rasters

To compliment the previous module where we had vector data, this module is with raster data.  This was an optional assignment but I decided to do it since I thought it would be useful to know how arcpy can operate on rasters.

The assignment was to create a raster that identifies an area of a map that fits all the following criteria: forested landcover, slope between 5 degrees and 20 degrees, aspect between 150 degrees and 270 degrees.  This sort of output would be useful in identifying things like where a particular endangered species of bird might nest and could be used to restricting construction or mining activities.

After importing the appropriate modules and setting up the environment, the first thing to do was to make sure that the spatial analysis extension was available.  The spatial analysis extension is a separately licensed feature and the number an institution has available (if any) is dependent on how many licenses they have and how many are currently in use.  I used a simple if/else statement to check this.  If one is available the program checks it, preforms the desired functions, then checks it back in at the end so others can use it.

The next step is to reassign the various forested landcover values all to the same value then reclassify those values.  I also then extracted by attributes on this raster so that only those with the assigned value existed in the new raster.  The creates a raster with only the appropriately forested areas.

Then I took the elevation raster and assigned it to a variable using the raster function.  I used this variable to create the slope and aspect raster using spatial analysis's slope and aspect functions.  I made sure that the slope function was set to degrees since that's what we would be measuring in for a later step.

I used map algebra to restrict the rasters created in the previous step.  Four temporary rasters where made: where the slope is greater than 5 degrees, where the slope is less than 20 degrees, where the aspect is greater than 150 degrees, and where the aspect is less than 270 degrees.  Both of the slope and aspect layers where then combined with the "&" to create a new raster with all of the restrictions.  I then combined that raster with the extracted landcover values raster for the final project.  Up to this point, all the created rasters have been temporary.  Since this is the final raster that I want, I made sure to save it with the .save method.

The green shows the suitable land that fits all the criteria.

Monday, June 15, 2020

Working with Geometries


The lesson this week was working with geometries.  This is a very useful and practical skill, as you can use python to transcribe data into a text file, or to take data and use it to create something within ArcGIS.  When you can have data for hundreds of polygons each with multiple points this is much easier than doing it all manually.

Our assignment was to create a .txt file within python and then write data from a river shapefile to that document.  This is done by creating a search cursor and setting the appropriate parameters that we will use to loop through each feature.

This process uses a nested loop.  The first loop uses the cursor to iterate through each row.  We then need a second loop to iterate through every point of that feature.  Within the previous loop, I created a variable called "vertexID" and set it to zero.  In the next loop, every point it goes through it increments up one.  This labels each point within a feature.  In the nested loop we use the .getPart() function on the row to create an array of points within each feature.  At this point I have the program transcribe the object ID, vertex ID, X coordinate, Y coordinate, and feature name to a line of text in the created file.  I also have the script print out each of these lines in the console so I can see the program's progress and check for errors.

The output of the program, showing each point within each feature.
A flow chart demonstrating how the nested loops work within the program.


Friday, June 12, 2020

Exploring & Manipulating Data

The focus of this week's assignment was to use python to create a geodatabase, populate it with copied files, and then learn how to use the search cursor function and how dictionaries operate.

Creating a file geodatabase uses arcpy's CreateFileGDB_management function.  The parameters are the output location of the fGDB and the name of it.
Code displaying that the fGDB was made.

Next was the matter of populating the fGDB.  We already had the files we already needed elsewhere and it is easy to copy each one over with a loop.  First, I made a list and populated it with arcpy.ListFeatureClasses().  Then for each feature class in the list I had it iterated over in a loop.  Within the loop  I used arcpy.CopyFeatures_management().  The first parameter was the feature class the loop was currently on, then the second parameter was made by concatenating the output environment path with the fGDB name and then using arcpy's describe function to get the basename of the file added on at the end.

Each feature class being copied over to the new fGDB.
 Now that the files have all been copied over, we have to change the workspace to the fGDB.  The next task is to iterate over all the county seats in the city feature class.  This is done by creating a search cursor.  A search cursor takes the parameters of a feature class and then a SQL query.  For this query I specified that the feature must be equal to 'County Seat'.  As it goes through the loop the program prints the name, feature type, and the population of the city in the year 2000.
The successful output of the search cursor.
Lastly, we learned the basic functionality of python dictionaries.  I started by creating a blank dictionary and then populating it with the same search cursor as was created in the previous step.  With the loop established, just one more line of code assigns a key based off of the city name and the population count as the corresponding value.

The creation and contents of the dictionary.

The flow chart showing the list of steps the code runs through from creation of the fGDB to the dictionary output.

Wednesday, June 3, 2020

Geoprocessing

This week we started to apply our python knowledge within ArcGIS itself.  Using scripting can make doing actions much faster and less monotonous than doing everything manually.

In the first part of the lab, we used ArcPro's model builder to create a multistep process that outputs a shapefile.  With the model builder you can drag and drop files and tools and combine them to preform actions in a certain order.  For our lab we made a clipping of all the soils within the extent of a basin.  Then simultaneously used the select tool to pick out all the soils that were classified as "not prime farmland" with a SQL query.  Lastly, we used the generated not prime farmland shapefile to erase from the soils within the file clipped from the basin.  This created a final product where all the good farmland within the basin area remained.

For the second part of the lab, we shifted gears and used the Spyder IDE.  There were three primary goals of the program I wrote: assign XY coordinates to a hospitals shapefile, create a 1000m buffer around those hospitals, and create a dissolved 1000m buffer around the hospitals.  This entailed importing the arcpy module to the freshly created script.  Then I set the workspace environment and set it so it was possible to overwrite output files which made it much easier to re-run scripts over and over while tweaking them.

Adding the XY coordinates to the hospitals was a matter of just running the appropriate module with the correct shapefile fed into the parameter.  The buffers were somewhat more involved since they take more parameters.  The first buffer needed three parameters: the file to create the buffer around, the path of the output file, and the size of the buffer itself.  The dissolved buffer took and extra three parameters, two of which were left blank since they don't apply to this situation and the last one set to 'ALL' so that the buffers would dissolve.  A dissolved buffer is were any overlap between buffers is combined so that the outputted polygons and melded together.

Lastly, I used the GetMessages module with stated the start time of each procedure, if it was successful, and how long each method took.  This shows that the program ran correctly, though I also double checked in ArcPro itself.


The program that gave the hospitals shapefile XY coordinates and also created the buffer layers successfully running.
Overall, I thought scripting would be much more intimidating for someone with a minimal computer science background.  I see how even fairly straightforward applications of Python can make doing operations in ArcGIS much easier as well as faster and I look forward to learning more applications.

Monday, May 25, 2020

Python Debugging

This week's assignment was all about debugging.  Errors in programming are inevitable so it's important to learn how to begin to approach them while learning how to code.  We were provided with three different scripts and had to fix them so that they would all run correctly.
For this class most of our coding is done in Spyder.  When you run a script in Spyder, like all IDEs if it gets hung up on an error it will tell you with some kind of error message, like a traceback or syntax error.  Sometimes the easiest way to find a problem in your code is simply to run it and then see where the problem is.
Once mistakes such as misspellings or incorrect capitalization are cleared up then the program can run correctly. 
Another way to approach debugging is to use Spyder's debugger.  With this, you can work through the code line by line and see what is happening at each point.  This is a good way to identify an error where the code is running but not giving you the sort of output that you are expecting.

This script had eight bugs that needed to be teased out before it would properly run.

Sometimes, you might want to sidestep a bug entirely.  You can do this by adding in a "try" and except clause.  For this section of the assignment we had to identify that part of the code with an error and put it into a "try" clause.  This means that the code will be attempted, but if it cannot run it will turn to the except clause instead of simply breaking.  For the "except" clause I added in an error message that would identify what the problem was and print that out.  Afterwards, the code would continue as normal.
As you can see in Part A an error message is printed out from the "except" clause.  However, Part B runs without issue.


A Flowchart showing the try/except process


Bug fixing can be tedious but it's important to have different approaches to problem solving.  The more errors you fix, the easier it become to figure out other bugs in the future.